

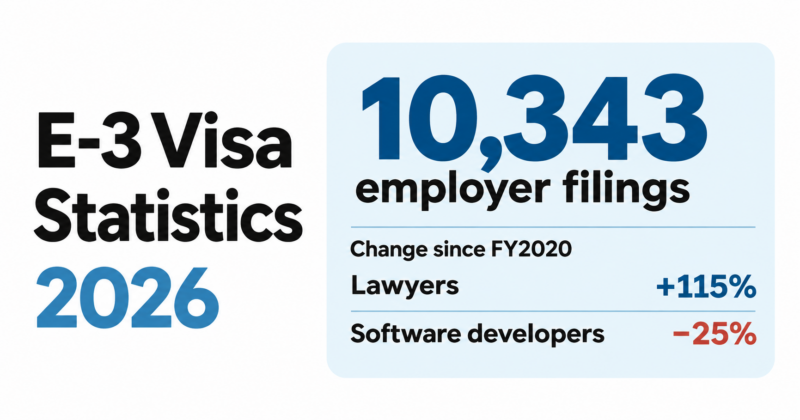









The Department of Labor has released the final quarter of FY2026, so we now have the full year. On the surface, it’s a recovery story: 10,343 E-3 filings, up 3.7% on FY2025 and the highest total in four years.
The bigger story is what’s happening underneath. The E-3 built its reputation as the visa that got Australian software developers into Silicon Valley. In FY2026, software developer filings were down a quarter on FY2020, lawyer filings more than doubled, and California lost ground to Texas and Florida.
America Josh analysis of US Department of Labor LCA disclosure data, FY2020–FY2026.
E-3 visa statistics for FY2026 at a glance
| Measure | FY2026 | Comparison |
|---|---|---|
| Total filings | 10,343 | Up 3.7% on FY2025 (9,976), highest since FY2022 (11,135) |
| Certified | 9,797 (94.7%) | In line with the 94–95% norm since FY2021 |
| Denied | 3.12% | Stable, down from a peak of 4.44% in FY2020 |
| Median wage offered | $157,000 | Up 30.8% from $120,000 in FY2020 |
| Mean wage offered | $175,499 | Up 31.4% from $133,529 in FY2020 |
| Distinct roles | 605 | Across about 20,000 employers |
These are Labor Condition Applications (LCAs), the wage attestation every E-3 employer files before the visa application. They count employer filings, not people or visas issued. One person renewing every two years shows up more than once. There’s more on what the numbers can and can’t tell you at the end.
Lawyers up, software developers down
Software developers are still the single biggest role on the E-3. But the trend since FY2020 points one way:



| Role | FY2020 | FY2023 | FY2026 | Change since FY2020 |
|---|---|---|---|---|
| Software developers | 1,293 | 1,057 | 963 | −25.5% |
| General and operations managers | 501 | 528 | 728 | +45.3% |
| Financial and investment analysts | 397 | 465 | 551 | +38.8% |
| Lawyers | 164 | 247 | 352 | +114.6% |
| Management analysts | 347 | 282 | 337 | −2.9% |
| Chief executives | 210 | 241 | 268 | +27.6% |
Software developer filings fell by more than 300 while the total barely moved, so something else filled the gap. Mostly, it was management, finance and law. Lawyer filings more than doubled in six years.
The sector data points the same way. Professional, scientific and technical services, the category that covers most tech and consulting, slipped from 39.5% of filings in FY2020 to 37.2%. Health care grew from 243 filings to 347, up 43%.
For Australians weighing a move, the takeaway is broader than tech. Finance, law, operations and senior management roles are now a growing share of the E-3.
Where E-3 jobs are: California slips, Texas and Florida climb
| State | FY2020 | FY2026 | Share of filings |
|---|---|---|---|
| New York | 3,243 | 3,343 | 31.1% → 32.3% |
| California | 2,908 | 2,355 | 27.8% → 22.8% |
| Texas | 653 | 1,022 | 6.3% → 9.9% |
| Florida | 242 | 433 | 2.3% → 4.2% |
| Washington | 545 | 367 | 5.2% → 3.5% |
California lost about a fifth of its E-3 filings while the national total held steady. Texas grew 56.5%, adding more filings than Florida, Nevada and Illinois combined. Florida grew 78.9%, from a smaller base.
New York already led, and its lead has widened. In FY2020 it had about 1.1 E-3 filings for every one in California. In FY2026, it was about 1.4.
One caution: these figures show where the job is, not where the worker lives. They’re a map of hiring, not of where Australians live.
The AI labs arrived
Among individual employers, the fastest movers in FY2026 were AI companies:
| Employer | FY2023 | FY2024 | FY2025 | FY2026 |
|---|---|---|---|---|
| Anthropic | 0 | 3 | 5 | 38 |
| OpenAI | 2 | 6 | 6 | 25 |
| Stripe | 4 | 6 | 12 | 18 |
| Baseten Labs | 0 | 0 | 0 | 14 |
| Databricks | 4 | 9 | 1 | 11 |
Anthropic went from 5 filings to 38 in a year and is now among the top 12 E-3 employers nationally, three years after its first filing.
The big platforms went the other way. Amazon fell from 287 filings to 247, Meta from 105 to 99, Microsoft from 52 to 41 and Tesla from 81 to 54. Google was flat at 122.
The employers nobody expected
Some of the most interesting names in this year’s E-3 visa statistics aren’t tech companies at all.
- Spirit Airlines jumped from 10 filings in FY2025 to 49 in FY2026. But 22 of those 49 were withdrawn and only 27 certified. The data doesn’t say why so many were pulled.
- SkyWest Airlines filed 32 times, and all 32 were certified. Its median wage rose 33% to $263,286, one of the highest of any employer with meaningful volume.
- LA28, the organizing committee for the Los Angeles Olympic and Paralympic Games, went from no filings before FY2025 to 6 that year and 18 in FY2026. The FIFA World Cup 2026 US entity filed 21 across the two years. Both are temporary employers, so expect them to disappear from the data within a few years.
- Australian names are setting up US arms. Macquarie Asset Management US filed 27 times in its first year on record, and new entrants Lorikeet AI (9) and Rosella Services (8) appeared for the first time.
E-3 roles are getting more senior
Every LCA assigns the job a prevailing wage level, from Level I (entry) to Level IV (fully competent, the top tier). In FY2026, Level IV reached 34.6% of filings, the highest in the seven years of data. Level III fell to 21.3%, its lowest.
| Fiscal year | Level I | Level II | Level III | Level IV |
|---|---|---|---|---|
| FY2020 | 17.7% | 29.7% | 23.4% | 29.2% |
| FY2023 | 14.7% | 27.8% | 23.8% | 33.7% |
| FY2026 | 16.8% | 27.2% | 21.3% | 34.6% |
That fits the role data: fewer junior developers, more senior managers and professionals. It also explains part of the 30.8% rise in the median wage since FY2020. Some of that rise is wage growth, and some is the mix of jobs shifting upward. The data can’t tell you how much is which.
What the E-3 visa statistics mean for you
There’s no E-3 season. Across the five settled years from FY2021 to FY2025, filings split almost evenly by quarter:
| Fiscal quarter | Months | Share of filings |
|---|---|---|
| Q1 | October–December | 23.9% |
| Q2 | January–March | 24.8% |
| Q3 | April–June | 25.9% |
| Q4 | July–September | 25.3% |
March is the busiest month and January the quietest, but the spread is only two points. Unlike the H-1B, the E-3 has no lottery or filing window. The annual cap of about 10,500 visas has never been reached, so there’s no race for slots. Employers file when they hire.
Look beyond tech. Software is still the biggest single role, but finance, law, operations and management are where the growth is. An employer outside tech may never have heard of the E-3, so it helps to know how to explain it. Our guide on whether the E-3 counts as sponsorship covers that conversation.
Look beyond California. New York is still the biggest E-3 market, and Texas and Florida are growing fastest.
Check the employer’s history. You can search any employer’s E-3 filings, roles and wages in our E-3 visa data explorer, which now includes the full FY2026 data.
How to read E-3 visa statistics
A few things to keep in mind:
- Filings aren’t people. Renewals and job changes each create a new filing, and there’s no way to count individuals from this data.
- Filings aren’t visas. Certification means the Department of Labor accepted the wage terms. The visa itself is a separate decision made by the State Department.
- Recent years get revised down. When a certified application is later withdrawn, its decision date moves, which shifts it into a later year. In this release alone, FY2025 lost 123 filings. FY2026’s 10,343 will likely settle closer to 10,200. That’s still the highest in four years, but it’s not a record.
FAQ
Employers filed 10,343 E-3 Labor Condition Applications in FY2026 (October 2025 to September 2026), up 3.7% on FY2025. These are employer filings, not individual people or visas issued.
No. About 10,500 E-3 visas are available each year, and issuance has never come close to that limit.
The median wage offered on E-3 filings in FY2026 was $157,000, and the mean was $175,499. The median is up 30.8% from $120,000 in FY2020.
New York, with 32.3% of FY2026 filings. California was second at 22.8%, followed by Texas at 9.9%.
Software developers are still the largest single role, with 963 filings in FY2026. General and operations managers (728), financial and investment analysts (551) and lawyers (352) are growing fastest.
No. Filings are spread almost evenly across the year, and because the cap has never been reached, there’s no deadline or filing window to beat.
Methodology: Figures are drawn from US Department of Labor Office of Foreign Labor Certification LCA disclosure data covering FY2020 Q1 to FY2026 Q4, filtered to the E-3 Australian visa class, for a total of 72,300 filings. Fiscal years run October to September and are assigned by decision date. Counts are of employer applications, not individual workers or visas issued, and one worker renewing appears multiple times. The Department of Labor revises decision dates when a certified application is later withdrawn, so recent-year totals decline slightly in later data releases.
This article is general information, not legal advice. Speak to an immigration attorney about your situation.