










This is the most complete public E-3 visa data tool in the United States. Every Australian filing since FY2020 is in this dataset. That’s about 67,000 records across 830 employers, 600 roles, and all 50 states. The source is US Department of Labor Labor Condition Application (LCA) disclosures, refreshed quarterl
Search and filter the full E-3 visa data
Use the search and filter below to drill into any role, employer, or state. Click any result for full details, year-over-year trends, and related entities.
E-3 Visa Roles
Searchable across 601 roles from 7 fiscal years of DOL LCA disclosure data. Search by role, actual job title (e.g. "CEO"), employer (e.g. "Amazon"), or SOC code (e.g. "15-1252").
What this E-3 visa data is, and why it exists
Before an Australian can work in the US on an E-3 visa, the employer must file a Labor Condition Application. The filing goes to the Department of Labor. The LCA confirms the role, the wage, the work site, and the employer’s pledge to pay the local prevailing wage. Every approved E-3 visa starts with one. Every rejected one shows up here too.
This makes LCA data much more reliable than self-reported job ads. These are legal filings, not marketing copy. If a company shows up here with 50 filings, they have paid lawyers to file paperwork for 50 Australians. They didn’t just say they “support work visa sponsorship.”



The data here answers questions that are otherwise hard for E-3 visa applicants to answer. Which US firms regularly hire Australians? What roles are most common? What wages are being paid in your field? Where are the jobs actually located?
For a full guide to how the E-3 visa works, see our E-3 visa overview page.
Browse E-3 visa data by role
There are about 600 distinct jobs in the dataset. The biggest is Software Developers, with around 7,500 filings. The spread is broad. A few common entry points:
- Software Developers — the largest role by volume
- Marketing Managers
- Financial and Investment Analysts
- Lawyers — among the highest-paid
- Chief Executives — also among the highest-paid
- Data Scientists — fastest-growing in 2026
- Management Analysts
Browse E-3 visa data by employer
Around 830 employers have filed 10 or more E-3 LCAs since FY2020. The largest is Amazon, with around 1,780 filings. The most active sponsors include both US tech giants and Australian-owned firms growing US teams.
- Amazon — the largest sponsor overall
- Meta
- Microsoft
- Macquarie Holdings (USA) — Australian-owned, dominant NY financial sponsor
- Atlassian — Australian-founded, steady sponsor
- Anthropic — fastest-growing E-3 sponsor in 2026
- OpenAI
Browse E-3 visa data by state
New York has hosted around 20,300 E-3 filings since FY2020. That’s the most of any state. California follows with 16,800. The top five states cover about two-thirds of all E-3 activity. But the spread is widening as mid-tier states grow their share.
Year-over-year trends
The dataset covers FY2020 through FY2026. FY2026 shows the first half only — Q1 and Q2, covering October 2025 through March 2026. FY2026 numbers in the explorer are partial-year actuals, not annual projections, unless marked. Doubling FY2026 H1 gives a useful compare against prior full years.
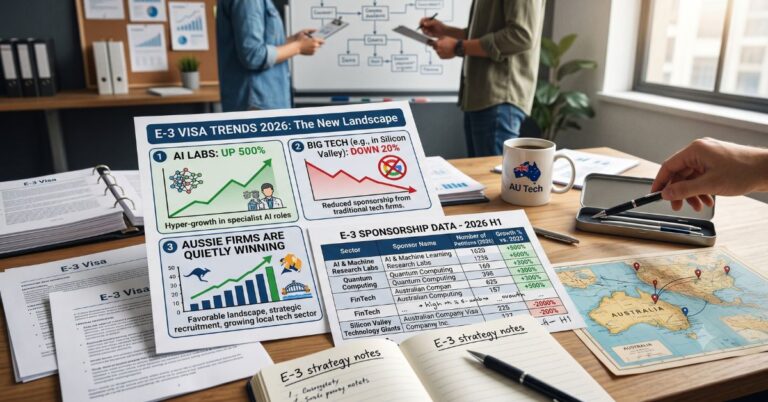
Two trends stand out for FY2026. Average wages are up about 4% year over year. And the mix of sponsoring employers is shifting fast. AI labs Anthropic and OpenAI are growing 200% to 500%. Australian firms like Macquarie and AustralianSuper are growing US headcount. Traditional Big Tech sponsors have pulled back 20% to 30% from 2025 levels. Our E-3 visa trends 2026 deep dive covers the full story.
How this E-3 visa data is sourced and maintained
The records come from the US Department of Labor Office of Foreign Labor Certification (OFLC). The OFLC publishes the public LCA disclosure files. Data publishes quarterly. We refresh this database within a few weeks of each release.
A few notes on methodology:
- LCA filings are not the same as visa issuances. Most certified LCAs turn into approved E-3 visas. A small share are filed and then not pursued by the worker, or denied at the consulate.
- Cumulative-quarter counts can shift between releases as the DOL reclassifies records. We re-pull the full historical file each quarter, not just the latest one.
- Wage outliers above $2 million per year are dropped from averages. This stops a few high-value pay packages from skewing typical-wage figures.
- Employer names are merged across legal-entity variants. “Amazon.com Services LLC”, “Amazon Web Services Inc.”, and dozens of related entities all roll up into a single Amazon record. This makes year-over-year comparisons useful. But entity-level filings won’t always match the canonical totals exactly.
If you spot an inconsistency, we want to hear about it. The Australian community using this dataset built it and keeps it current.
E-3 visa data FAQs
The E-3 visa cap is 10,500 new issues per year. In FY2025, there were 10,191 certified LCA filings. FY2026 looks similar, with 5,122 filings in the first half. The total number of Australians on E-3 status in the US is higher than the cap. That’s because the visa is renewable in two-year blocks.
Amazon leads with about 1,780 filings since FY2020. Other top sponsors include Google, Meta, Microsoft, and Australian firms like Macquarie, Atlassian, and Canva. The full searchable list is in the explorer above.
The FY2026 H1 average wage is $171,671. That’s up from $165,317 in FY2025 and $132,175 in FY2020. Wages have gone up every year. That’s about 30% nominal growth since 2020.
New York leads with around 20,300 filings since FY2020, followed by California at 16,800. Texas, Washington, and Florida round out the top five. Mid-tier states like Tennessee, Pennsylvania, Maryland, and Ohio are growing fastest in FY2026.
Yes. Amazon, Google, Meta, and Microsoft are all in the top 20 E-3 sponsors by volume. Apple is a steady but smaller sponsor. The frontier AI labs — Anthropic and OpenAI — are the fastest-growing sponsors in 2026. Their absolute numbers stay below Big Tech levels.
Every record comes from US Department of Labor OFLC public LCA files. The DOL publishes the data quarterly. We refresh the database within a few weeks of each release.
Quarterly, after each DOL release. Look for the “updated” date stamp on the explorer above.
Considering an E-3 visa yourself?
If you’re thinking about applying for an E-3 visa, start with our complete 2026 E-3 visa guide. It covers eligibility, the steps, recent policy changes, renewals, and family details. The data on this page is most useful when you know which roles and employers you’re after.
You might also like
 Related to: E-3 Visa TrendsE-3 Visa Trends 2026: AI Labs Up 500%, Big Tech Down 20%, and Why Aussie Firms Are Quietly Winning
 Related to: Work Visa RequirementsE-3 Visa Data Details
 Related to: E-3 Visa TrendsE-3 Visa Trends Q3 2026: Consulting Surges, Big Law Piles In, and Three Companies That Contradict Themselves
 Related to: Australian Work VisaE-3 Visa: Complete Australian Guide to US Work Visas (2026)
 Related to: Australian Immigration To AmericaHow Many Australians Live in America? (2026 Data)
 Related to: E-3 Visa SponsorshipIs the E-3 Visa Considered Sponsorship?