SOC code 15-2041
There have been 213 US Department of Labor LCA filings for Statisticians on the E-3 visa across all available fiscal years, with 88.7% certified. The median annualized wage is $142,069. The top sponsor is Amazon, with most positions based in CA.
All sponsoring employers
97 distinct employers have filed E-3 LCAs for Statisticians. Search or sort below.
| Employer | Filings | Cert rate | Median wage | Top state | Top city |
|---|---|---|---|---|---|
| Amazon | 14 | 100.0% | $150,400 | WA | Seattle |
| 13 | 84.6% | $173,000 | NY | New York | |
| Meta | 13 | 92.3% | $180,800 | CA | Menlo Park |
| Uber | 8 | 87.5% | $127,000 | CA | San Francisco |
| January Technologies | 6 | 100.0% | $129,771 | MA | East Boston |
| Earnix | 5 | 100.0% | $165,000 | MA | Waltham |
| Pb Tech Advisory | 5 | 80.0% | $75,000 | CO | Denver |
| Transunion | 5 | 60.0% | $91,728 | IL | Chicago |
| A T Kearney | 4 | 100.0% | $250,000 | IL | Chicago |
| Fortrea | 4 | 100.0% | $91,000 | GA | Ball Ground |
| Futures Action Network | 4 | 100.0% | $200,000 | NY | New York |
| Grubhub Holdings | 4 | 50.0% | $130,000 | MA | Boston |
| The Vanguard Group | 4 | 100.0% | $220,000 | PA | Malvern |
| JPMorgan Chase | 3 | 100.0% | $235,000 | NY | New York |
| Kelvin | 3 | 100.0% | $130,000 | CA | Louisville |
| Propel32 | 3 | 100.0% | $167,814 | NY | New York |
| Rent The Runway | 3 | 100.0% | $167,814 | NY | Brooklyn |
| Safegraph | 3 | 0.0% | $130,000 | CO | Brooklyn |
| Steelcase | 3 | 33.3% | $82,400 | MI | Grand Rapids |
| University Of Wisconsin System | 3 | 100.0% | $97,157 | WI | Madison |
| Urgent Ly | 3 | 33.3% | $120,000 | VA | Arlington |
| Wayfair | 3 | 100.0% | $93,000 | MA | Boston |
| Ancile | 2 | 100.0% | $92,446 | CA | Alhambra |
| Cambium Assessment | 2 | 100.0% | $91,350 | DC | Washington |
| Carelon Management Services | 2 | 50.0% | $182,651 | NJ | South Plainfield |
| Charity Navigator | 2 | 100.0% | $100,003 | NJ | Saddle Brook |
| Doordash | 2 | 50.0% | $201,000 | CA | San Francisco |
| Fbg Enterprises Opco | 2 | 100.0% | $76,099 | CO | Denver |
| General Hospital | 2 | 100.0% | $91,126 | MA | Charlestown |
| Lowe'S Companies | 2 | 100.0% | $92,043 | NC | Mooresville |
| Mars Petcare US | 2 | 100.0% | $183,193 | NY | Franklin |
| McKinsey & Company | 2 | 100.0% | $167,850 | NY | New York |
| Pang'S Bbq | 2 | 100.0% | $27,477 | FL | Orlando |
| Phoenix Jiu Bond USA | 2 | 100.0% | $73,986 | FL | Winter Park |
| 2 | 100.0% | $131,644 | CA | San Francisco | |
| Radix Trading | 2 | 100.0% | $150,000 | IL | Chicago |
| Research Triangle Institute | 2 | 100.0% | $156,083 | NC | Durham |
| Spire Global | 2 | 100.0% | $107,100 | CO | Boulder |
| The Clear Fund | 2 | 100.0% | $109,551 | CA | Oakland |
| The Nielsen Company (US) | 2 | 100.0% | $100,213 | CA | Chicago |
| The Sphere Institute | 2 | 100.0% | $156,499 | CA | Burlingame |
| The University Of Chicago | 2 | 50.0% | $103,045 | IL | Chicago |
| University Of Florida | 2 | 100.0% | $79,669 | FL | Gainesville |
| Walleye Capital | 2 | 100.0% | $350,000 | NY | New York |
| 6Sense Insights | 1 | 100.0% | $107,500 | CA | San Francisco |
| Adara | 1 | 100.0% | $135,000 | CA | Palo Alto |
| Aetna Resources | 1 | 100.0% | — | NY | New York |
| Affirm | 1 | 100.0% | $172,000 | CA | San Francisco |
| Afiniti | 1 | 100.0% | $143,000 | DC | Washington |
| Alt Platform | 1 | 0.0% | $160,000 | NY | New York |
Top states
Where Statisticians E-3 jobs are concentrated.

| State | Filings | Median wage |
|---|---|---|
| CA | 52 (25.1%) | $160,344 |
| NY | 51 (24.6%) | $167,814 |
| MA | 20 (9.7%) | $129,771 |
| IL | 16 (7.7%) | $122,500 |
| WA | 13 (6.3%) | $148,400 |
| CO | 10 (4.8%) | $94,730 |
| FL | 8 (3.9%) | $73,986 |
| NC | 8 (3.9%) | $118,950 |
| NJ | 6 (2.9%) | $113,017 |
| DC | 5 (2.4%) | $92,700 |
| GA | 4 (1.9%) | $91,000 |
| PA | 4 (1.9%) | $220,000 |
| VA | 4 (1.9%) | $135,750 |
| MI | 3 (1.4%) | $82,400 |
| WI | 3 (1.4%) | $97,157 |
Top cities
Cities where Statisticians E-3 jobs are filed.
| City | State | Filings | Median wage |
|---|---|---|---|
| New York | NY | 44 | $173,000 |
| San Francisco | CA | 22 | $165,000 |
| Chicago | IL | 15 | $125,000 |
| Menlo Park | CA | 13 | $180,800 |
| Seattle | WA | 11 | $142,800 |
| Boston | MA | 9 | $130,000 |
| Brooklyn | NY | 6 | $136,500 |
| Denver | CO | 6 | $72,500 |
| Durham | NC | 6 | $136,033 |
| Washington | DC | 5 | $92,700 |
| Ball Ground | GA | 4 | $91,000 |
| East Boston | MA | 4 | $129,771 |
| Waltham | MA | 4 | $165,000 |
| Arlington | VA | 3 | $120,000 |
| Grand Rapids | MI | 3 | $82,400 |
Job titles within this role
The actual job titles employers used in their filings. Useful when the SOC label is generic — e.g. "CEO" / "Chief Executive Officer" both fall under Chief Executives.
| Job title | Filings |
|---|---|
| Data Scientist | 18 |
| Senior Data Scientist | 5 |
| Professional Services Consultant | 4 |
| Principal | 4 |
| PRODUCT ANALYST | 4 |
| Manager, Product Analytics | 4 |
| Data Scientist | 4 |
| DATA SCIENTIST II | 4 |
| Sr. Data Scientist | 3 |
| Psychometrician | 3 |
| Manager, Data Science | 3 |
| Manager III, Data Engineering | 3 |
| Data Science Manager | 3 |
| Data Science Analyst | 3 |
| Data Analyst | 3 |
| Advice Principal Data Scientist | 3 |
| Statistical Programmer/Analyst | 2 |
| Statistical Programmer I | 2 |
| Statistical Data Scientist (BAL 20730.0.1) | 2 |
| Sports Analyst | 2 |
| Snr. Product Manager | 2 |
| Senior Statistician 3 | 2 |
| Senior Sports Analyst | 2 |
| Senior Product Analyst | 2 |
| Senior Manager of Data Science | 2 |
| Senior Business Intelligence (BI) Analyst | 2 |
| Research Manager | 2 |
| Research Associate | 2 |
| Quantitative Technologist | 2 |
| Product Analyst | 2 |
Filings by fiscal year
Year-over-year trend in E-3 LCA filings for Statisticians. DOL's fiscal year runs October–September.
| FY | Filings | Cert rate | Median wage | Trend |
|---|---|---|---|---|
| FY2020 | 48 | 89.6% | $129,709 | |
| FY2021 | 54 | 96.3% | $130,000 | |
| FY2022 | 49 | 81.6% | $150,000 | |
| FY2023 | 28 | 89.3% | $160,000 | |
| FY2024 | 20 | 95.0% | $129,771 | |
| FY2025 | 11 | 81.8% | $170,000 | |
| FY2026 | 3 | 33.3% | $125,000 |
Frequently asked questions
How many Statisticians have been sponsored on the E-3 visa?
There have been 213 Labor Condition Application filings for Statisticians on the E-3 visa across all available fiscal years, with 88.7% of applications certified by the US Department of Labor.
What is the median wage for Statisticians on the E-3 visa?
The median annualized wage for Statisticians on the E-3 visa is $142,069, based on certified LCA filings. Wage outliers above $2 million are excluded from this calculation.
Which employers sponsor the most Statisticians on the E-3 visa?
The top E-3 visa sponsors of Statisticians are: Amazon (14 filings), Google (13 filings), Meta (13 filings). The full list of sponsoring employers is shown above.
Where are E-3 visa statisticians based in the US?
Most E-3 visa filings for Statisticians are based in: CA (52 filings), NY (51 filings), MA (20 filings).
Can Australians work as statisticians on the E-3 visa?
Yes. The E-3 visa is exclusive to Australian citizens and is one of the most common visa categories for skilled professionals working in the United States. Statisticians is regularly sponsored under the E-3 visa, as the data on this page shows.
Looking for a different role, employer, or state?
Browse all E-3 visa dataYou might also like
 Related to: E3 Visa EmploymentE3 Visa Database: List of E3 Visa Employers 2020-2026
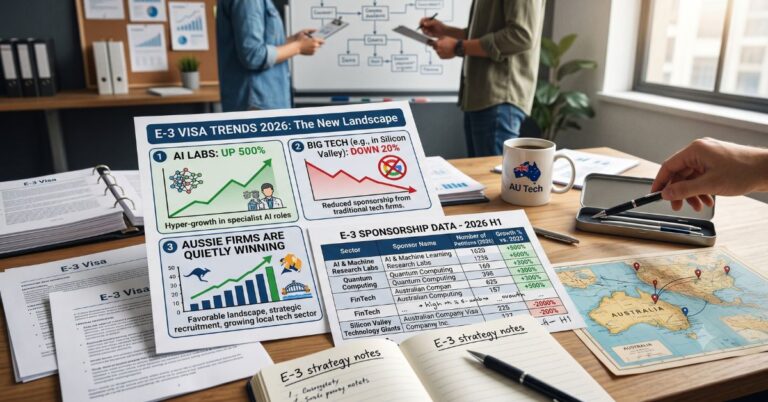 Related to: E-3 Visa TrendsE-3 Visa Trends 2026: AI Labs Up 500%, Big Tech Down 20%, and Why Aussie Firms Are Quietly Winning
 Related to: E3 Visa EmploymentE3 Visa Data: Q2 2025 (Department of Labor Analysis)Related to: Event TicketingTicket Details
 Related to: Australian Work VisaE-3 Visa: Complete Australian Guide to US Work Visas (2026)Related to: VisaB1/B2 Visa – Visas for Business & Visiting the United States in 2026